Business
Visualizing Annual Working Hours in OECD Countries


Visualizing Annual Working Hours in OECD Countries
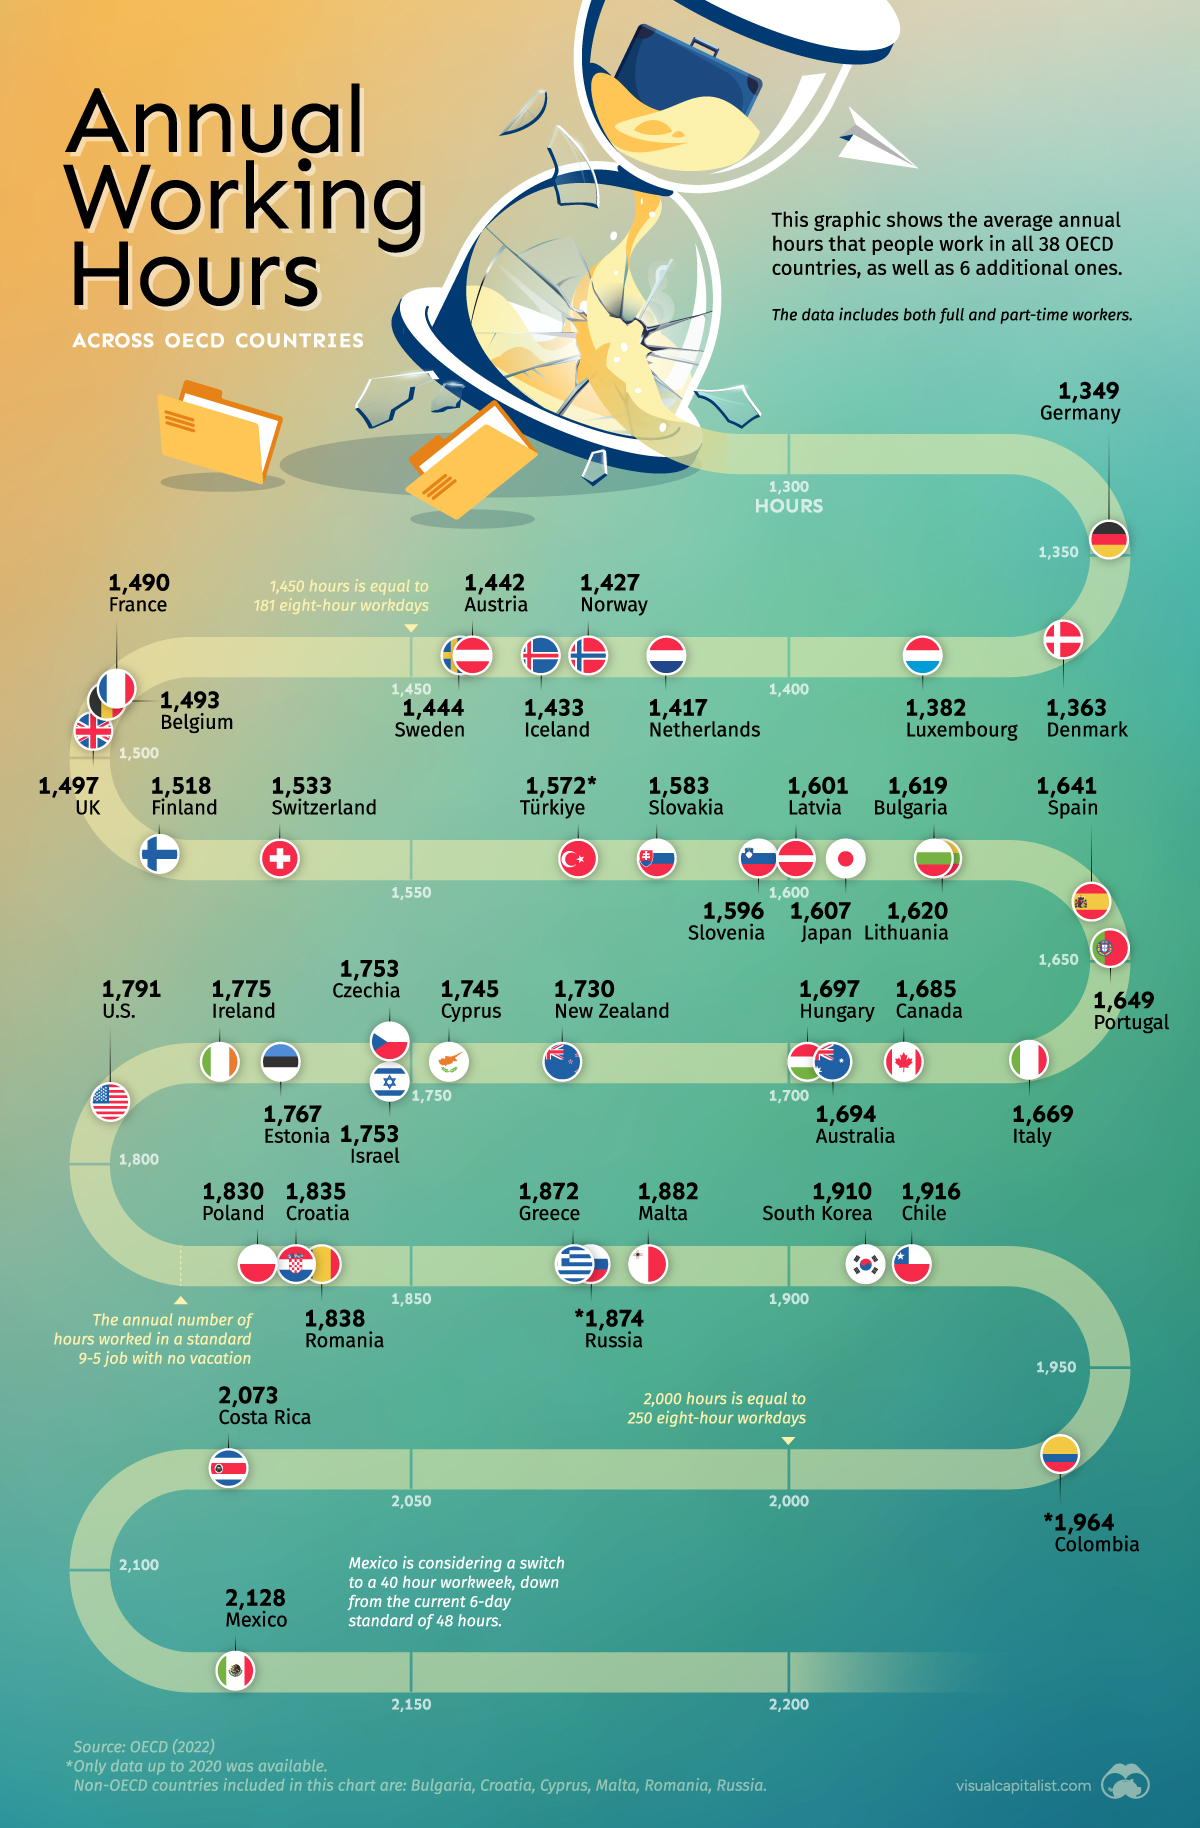
Comparing the number of hours people work in different countries can provide insight into cultural work norms, economic productivity, and even labor laws.
With this in mind, we’ve ranked OECD countries (plus a few others) based on their average annual hours worked. Note that this data includes both full-time and part-time workers.
Data and Highlights
The data we sourced from OECD is listed in the table below. All figures are as of 2021 (latest available), with the exception of Colombia, Russia, and Türkiye which are as of 2020.
| Country | Average annual hours worked |
|---|---|
| 🇲🇽 Mexico | 2,128 |
| 🇨🇷 Costa Rica | 2,073 |
| 🇨🇴 Colombia | 1,964 |
| 🇨🇱 Chile | 1,916 |
| 🇰🇷 South Korea | 1,910 |
| 🇲🇹 Malta* | 1,882 |
| 🇷🇺 Russia* | 1,874 |
| 🇬🇷 Greece | 1,872 |
| 🇷🇴 Romania* | 1,838 |
| 🇭🇷 Croatia* | 1,835 |
| 🇵🇱 Poland | 1,830 |
| 🇺🇸 United States | 1,791 |
| 🇮🇪 Ireland | 1,775 |
| 🇪🇪 Estonia | 1,767 |
| 🇨🇿 Czech Republic | 1,753 |
| 🇮🇱 Israel | 1,753 |
| 🇨🇾 Cyprus* | 1,745 |
| 🇳🇿 New Zealand | 1,730 |
| 🌐 OECD average | 1,716 |
| 🇭🇺 Hungary | 1,697 |
| 🇦🇺 Australia | 1,694 |
| 🇨🇦 Canada | 1,685 |
| 🇮🇹 Italy | 1,669 |
| 🇵🇹 Portugal | 1,649 |
| 🇪🇸 Spain | 1,641 |
| 🇱🇹 Lithuania | 1,620 |
| 🇧🇬 Bulgaria* | 1,619 |
| 🇯🇵 Japan | 1,607 |
| 🇱🇻 Latvia | 1,601 |
| 🇸🇮 Slovenia | 1,596 |
| 🇸🇰 Slovakia | 1,583 |
| 🇹🇷 Türkiye | 1,572 |
| 🇨🇭 Switzerland | 1,533 |
| 🇫🇮 Finland | 1,518 |
| 🇬🇧 United Kingdom | 1,497 |
| 🇧🇪 Belgium | 1,493 |
| 🇫🇷 France | 1,490 |
| 🇸🇪 Sweden | 1,444 |
| 🇦🇹 Austria | 1,442 |
| 🇮🇸 Iceland | 1,433 |
| 🇳🇴 Norway | 1,427 |
| 🇳🇱 Netherlands | 1,417 |
| 🇱🇺 Luxembourg | 1,382 |
| 🇩🇰 Denmark | 1,363 |
| 🇩🇪 Germany | 1,349 |
*Non-OECD country
At the top is Mexico, where the average worker clocks over 2,000 hours per year. This reflects the country’s labor dynamics, which typically involves a six-day workweek. For context, 2,128 hours is equal to 266 eight-hour workdays.
The only other country to surpass 2,000 annual hours worked per worker is Costa Rica, which frequently tops the World Economic Forum’s Happy Planet Index (HPI). The HPI is a measure of wellbeing, life expectancy, and ecological footprint.
Looking at the other end of the list, the two countries that work the fewest hours are Germany and Denmark. This is reflective of the strong labor laws in these countries as well as their emphasis on work-life balance.
For example, the German Working Hours Act (Arbeitszeitgesetz) states that daily hours of work may not exceed eight hours. Days can be extended to 10 hours, but only if it averages out to eight hours per working day over a six-month period.
Working fewer hours doesn’t mean that a country is becoming less productive, though. Germany is known for its high value industries like automotive and pharmaceuticals, where robotics and other technologies can greatly enhance productivity.
This is supported by GDP per capita, in which Germany has grown substantially since 2000.
Limitations of this Data
A limitation of this dataset is that it aggregates both full-time and part-time workers. This means that in a country like Japan, where almost 40% of the workforce is non-regular (part-time, contract, etc.), the average figure could be skewed downwards.
Japan is known for its grueling office culture, and it’s likely that many workers are logging significantly more hours than the 1,607 figure reported.
If you enjoy comparisons like these, consider taking a look at our ranking of cities with the best work-life balance.


Markets
The Top Private Equity Firms by Country
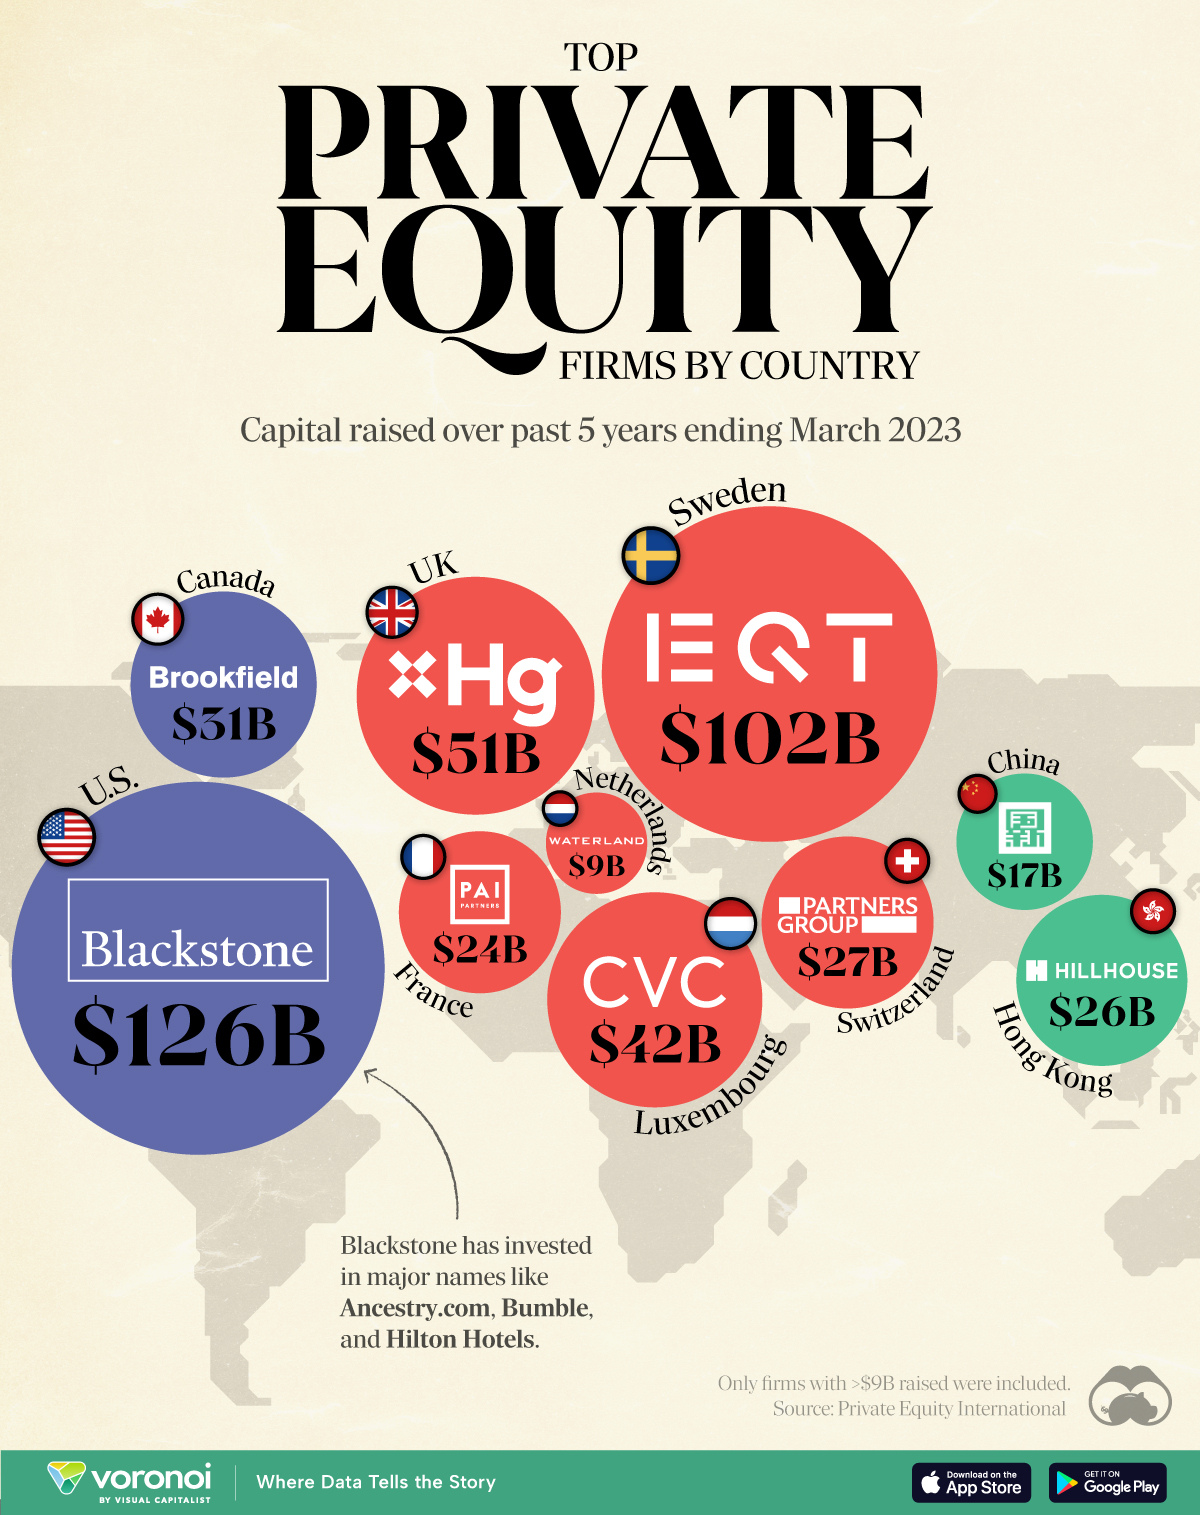
This map visualizes the leading private equity firms of major countries, ranked by capital raised over the past five years.
The Top Private Equity Firms by Country
This was originally posted on our Voronoi app. Download the app for free on iOS or Android and discover incredible data-driven charts from a variety of trusted sources.
Private equity firms are investment management companies that pool investor capital to acquire stakes in private companies. Through strategic management, they aim to enhance the value of these companies, then profit from a future sale or public offering.
To gain insight into this industry, we’ve visualized the top private equity firms in various countries, ranked by the amount of capital they raised over the past five years ending March 2023.
The cutoff for inclusion in this graphic was $9 billion raised. All figures come from Private Equity International’s PEI 300 ranking.
Data and Highlights
The data we used to create this graphic is included in the table below.
| Country | Firm | Amount raised |
|---|---|---|
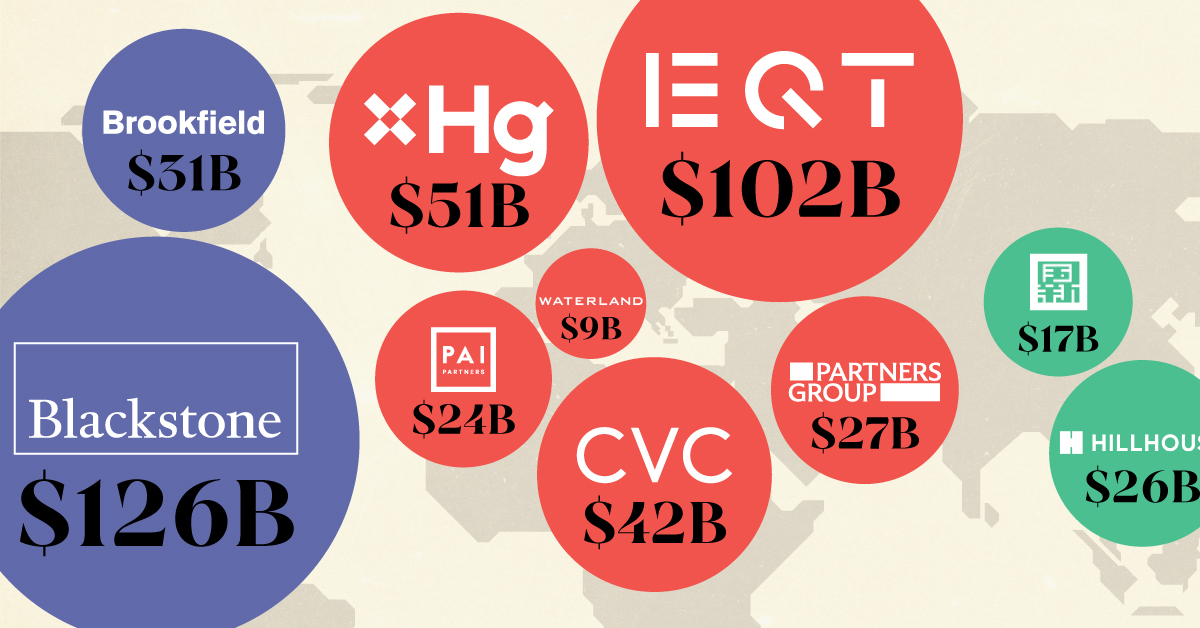
| 🇺🇸 US | Blackstone | $126B |
| 🇸🇪 Sweden | EQT | $102B |
| 🇬🇧 UK | Hg | $51B |
| 🇱🇺 Luxembourg | CVC Capital Partners | $42B |
| 🇨🇦 Canada | Brookfield Asset Management | $31B |
| 🇨🇭 Switzerland | Partners Group | $27B |
| 🇭🇰 Hong Kong | Hillhouse Capital Group | $26B |
| 🇫🇷 France | PAI Partners | $24B |
| 🇨🇳 China | China Reform Fund Management Corp | $17B |
| 🇳🇱 Netherlands | Waterland Private Equity | $9B |
U.S.-based Blackstone is the world’s largest private equity firm, with operations in additional areas like credit, infrastructure, and insurance.
While not shown in this graphic, the U.S. largely dominates the private equity landscape. If we were to rank the top 10 private equity firms by the same metric (capital raised over past five years), U.S. firms would account for eight of them.
More About Blackstone
Blackstone was founded in 1985 by Peter G. Peterson and Stephen A. Schwarzman, both former Lehman Brothers employees.
Notably investments that Blackstone has made include Ancestry.com, where it acquired a majority stake for nearly $5 billion in 2020.
In 2007, it also acquired Hilton Worldwide (one of the world’s biggest hotel operators) for roughly $26 billion.
Sweden’s EQT
EQT is Sweden’s largest private equity firm, and third largest globally. It is just one of three firms that have raised over $100B in capital over the past five years alongside Blackstone and KKR (also American).
EQT made news earlier this year when it raised $24B in two years for its EQT X private equity fund, which invests in the healthcare, technology and tech-enabled service sectors.
If you found this post interesting, check out this graphic that visualizes the most common types of investments that financial advisors use with their clients.

-

 Culture6 days ago
The World’s Top Media Franchises by All-Time Revenue
-

 Science2 weeks ago
Visualizing the Average Lifespans of Mammals
-

 Brands2 weeks ago
How Tech Logos Have Evolved Over Time
-

 Energy2 weeks ago
Ranked: The Top 10 EV Battery Manufacturers in 2023
-

 Countries2 weeks ago
Countries With the Largest Happiness Gains Since 2010
-

 Economy2 weeks ago
VC+: Get Our Key Takeaways From the IMF’s World Economic Outlook
-

 Demographics1 week ago
The Countries That Have Become Sadder Since 2010
-

 Money1 week ago
Charted: Who Has Savings in This Economy?